
Today we will discuss about memory leaks, what are these, what is causing them and how to find them using a tool called Java VisualVM.
What is a memory leak
First we need to understand the HEAP. When a new Java application is started, some amount of dynamic memory space (customizable) is reserved to this process. This memory is shared between all the threads and all objects created in the application have references that point to some memory address that is part of this allocated memory. This allocated memory is called the HEAP. On platforms like JVM, the management of the HEAP is done automatically, meaning that when we remove all assignments to an object (there is no way to access this object anymore using variables) the JVM will run the Garbage Collector to deallocate any memory that is no directly referenced in the application.
So memory leaks are practically chunks of memory that were not allocated because some variable was not destroyed. Reasons for this could be many like: a function or block call was not terminated so it still exists on the Stack (the Stack is a data structure that holds all the running methods, static type variables and object references that run on a Thread, piled up using the FILO logic). Worst case is when these lost variables are Collections that continue to grow during the life of a running application consume all the available memory.
Because Java applications run on the JVM, any memory leaks coming from the application will be cleared by the JVM when the application exits. So the application does not take memory directly from the OS, the JVM does. This way it is ensured that any memory is cleared after the application exits even when the application fails.
Luckily we have a great tool called Java VisualVM that comes with the JDK and it is great to investigate memory leaks.
Dummy application implementation
I prepared a simple dummy application to simulate a memory leak. This runs on SpringMVC and we can create resources using the POST /resources, see the resources collection using GET /resources and clear all resources using DELETE /resources.
The resourceDb collection will act as a persistance store for all resources. The ids Set will hold all existing ids that are randomly generated by the application when calling the POST method.
@RestController(value = "/resources")
public class ResourceController {

    public static List<Resource> resourceDb = new ArrayList<>(); // simulates persistence store
    public static Set<Integer> ids = new HashSet<>();  // stores IDs of resources
    private static final int MAX_ID_VALUE = 10; // max ID value

    /**
     * Get the list of all resources.
     * @return {@Code List<Resource>}
     */
    @RequestMapping(method = RequestMethod.GET)
    public List<Resource> getResources() {
        return ids.stream()
                .map(this::findResourceById)
                .collect(Collectors.toList());
    }

    /**
     * Create a new resource with the selected data and randomly generated id.
     * @param data the resource data
     */
    @RequestMapping(method = RequestMethod.POST)
    public synchronized void setResource(@RequestParam String data) {
        int id = new Random().nextInt(MAX_ID_VALUE);
        ids.add(id);
        Resource resource = new Resource(id, data);
        resourceDb.add(resource);
        System.out.println(resourceDb);
        System.out.println(ids);
    }

    /**
     * Clear all resources.
     */
    @RequestMapping(method = RequestMethod.DELETE)
    public synchronized void clearResources() {
        List<Integer> idsClone = new ArrayList<>(ids);
        idsClone.forEach(this::deleteResource);
    }

    /**
     * Remove a resource by it's id.
     * @param id the id of the resource to remove.
     */
    private void deleteResource(int id) {
        Resource resource = findResourceById(id);
        resourceDb.remove(resource);
        ids.remove(id);
    }

    private Resource findResourceById(int id) {
        for (Resource resource : resourceDb) {
            if (resource.getId()==id) return resource;
        }
        throw new RuntimeException("Resource with id " + id + " not found.");
    }
}
And the Resource class:
public class Resource {

    private int id;
    private String data;

    // constructors, getters, setters, equals, hashCode and toString here
}
So when the POST /resources?data=some_data_here is called, it will generate a new ID as an integer, it will save this ID in the ids Set, it will create a new Resource with this ID and the data prom params and will save this Resource in the resourceDb collection.
When calling DELETE /resources it will iterate over all IDs from ids Set and for each ID it will remove the corresponding Resource from resourcesDb.
The memory leak happens here when an ID is generated that already exists in the ids Set and another Resource with same ID is saved in the resourceDb collection. When calling the DELETE method, it will remove only one Resource per ID leaven the other resources in the resourceDb collection while ids Set is empty. So we will have objects in resourceDb that we don’t have access to through our API but they are consuming memory. And these resources can grow infinitely resulting in an application crash with an Out Of Memory exception.
Dummy application in action
Let’s create some resources:
curl -v -X POST localhost:8080/resources?data=a1
curl -v -X POST localhost:8080/resources?data=a2
curl -v -X POST localhost:8080/resources?data=a3
curl -v -X POST localhost:8080/resources?data=a4
It will create the following resources:
resourcesDb: [Resource{id=1, data='a0'}, Resource{id=7, data='a1'}, Resource{id=6, data='a2'}, Resource{id=0, data='a3'}, Resource{id=7, data='a4'}]
ids:         [0, 1, 6, 7]
- Notice we have
Resource{id=7, data='a1'}andResource{id=7, data='a4'}with same ID and inidsthere is7only once.
Let’s clear resources:
curl -v -X DELETE http://localhost:8080/resources
It will result in the following:
resourcesDb: [Resource{id=7, data='a4'}]
ids:         []
And reading all resources will result in empty array.
curl -X GET localhost:8080/resources
[]
It is clear that Resource{id=7, data='a4'} is a object that leaked from our system. And if we scale this to millions of requests then these leaking resources will occupy a significant part of the memory. This can heart the application very badly.
Simulating thousands of requests with JMeter
In our case we know that the resourceDb is the collection that holds the leaked objects, but usually when a memory leak happens in an application we do not know the cause of it and have to find these objects that are leaking. Since Spring MVC will also consume a lot of memory, create thousands of objects by simulating thousands of POST requests.
First I will set the MAX_ID_VALUE to 10000 so we have a bigger margin for ID values. To set a memory limit per running java application, I will start the java app with the flag -Xmx256m (maximum allocated memory will be 256 Mb). This way the GC will be invoked more often by the JVM.
I prepared a configuration to do this using JMeter, a great tool to stress test any application. The JMeter config file can he found here. It will use 1000 concurrent threads to call POST /resources?data=${random_data} every 100 ms. It will do this until stopped manually.
Inspecting the memory with Java VisualVM
In the JDK installation folder, we can find bin/jvisualvm application. Let’s start it. While the memory leak application is running we will see it listed in jvisualvm UI. Let’s open it and go to the Monitor tab. We will investigate the Heap graph.
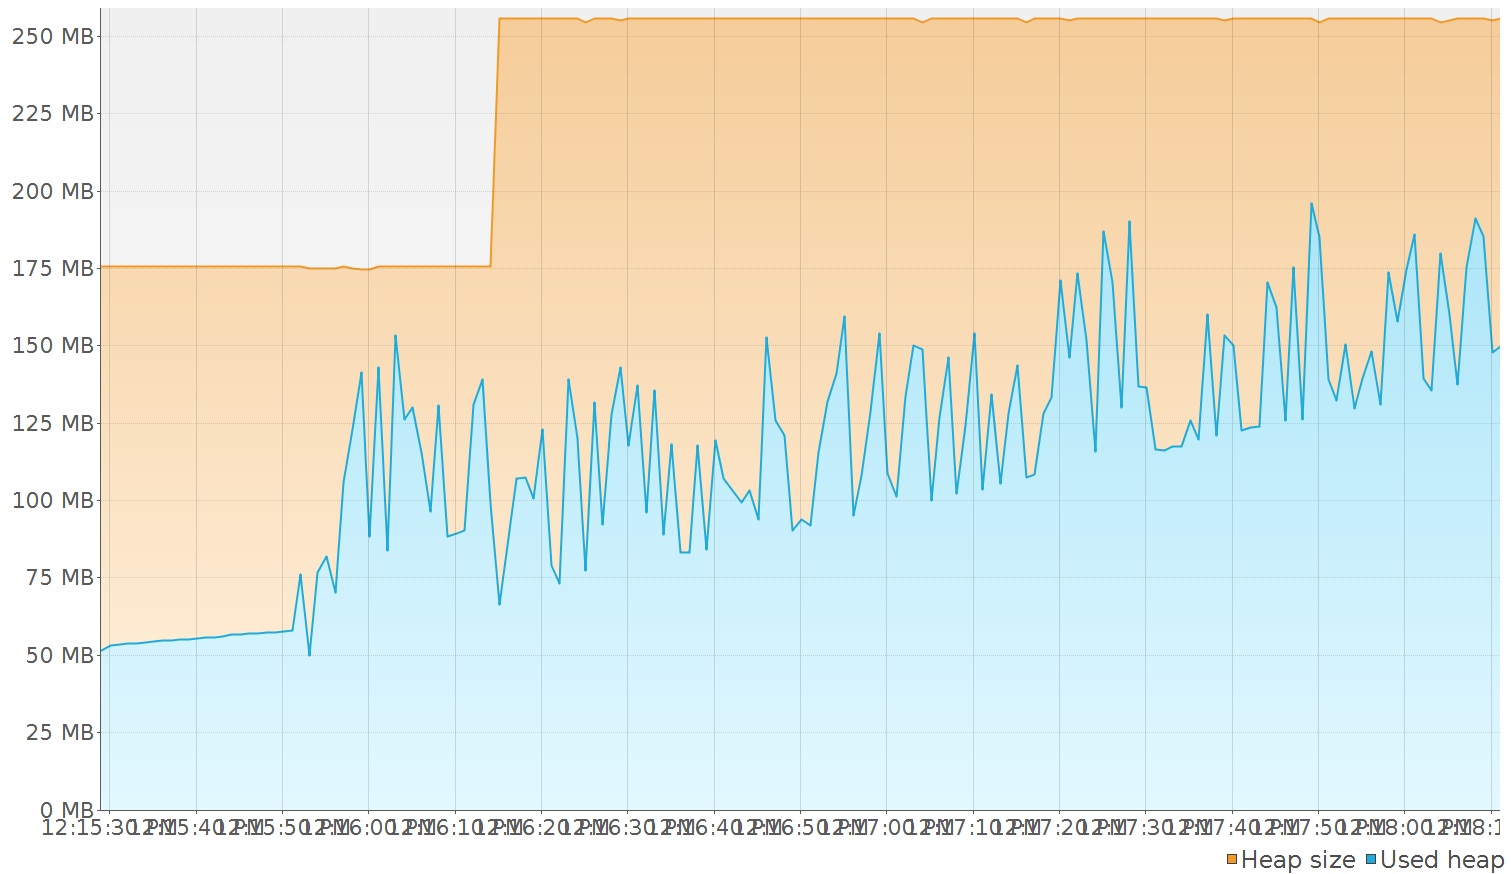
While JMeter will fire thousands of requests, creating thousands of resources, the consumed memory will increase gradually from around 50mb to around 150mb. See results in next image:
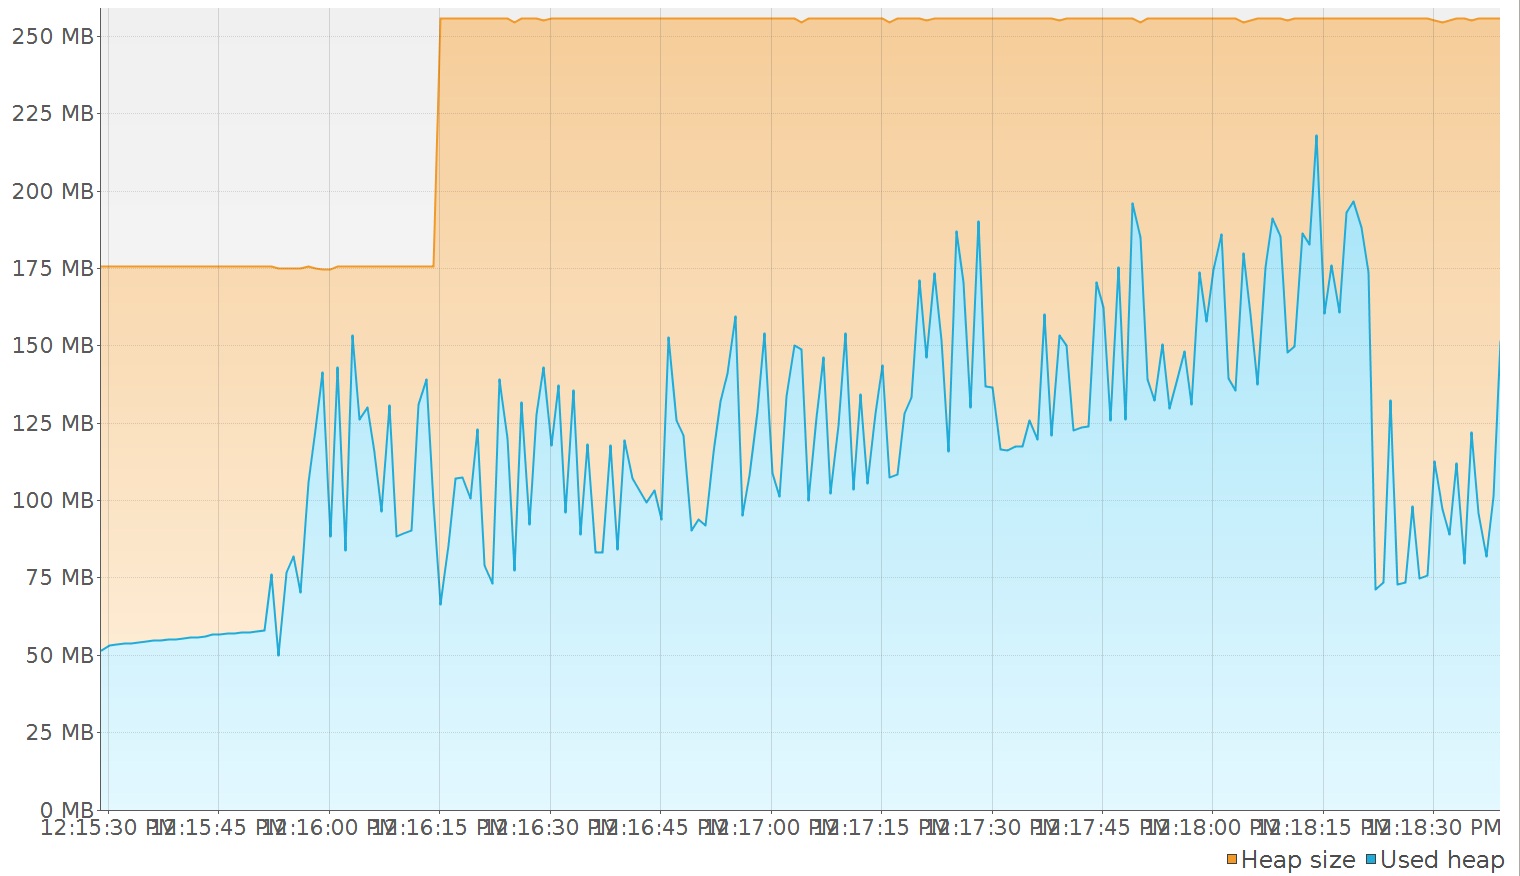
By firing the DELETE /resources request while JMeter is still running we notice the memory is cleared from around 150mb to around 75Mb. But it is not at 50mb as it was initially, 25Mb were stuck somewhere. And memory continues to increase while JMeter is running. The results after a DELETE request can be seen in the following image:
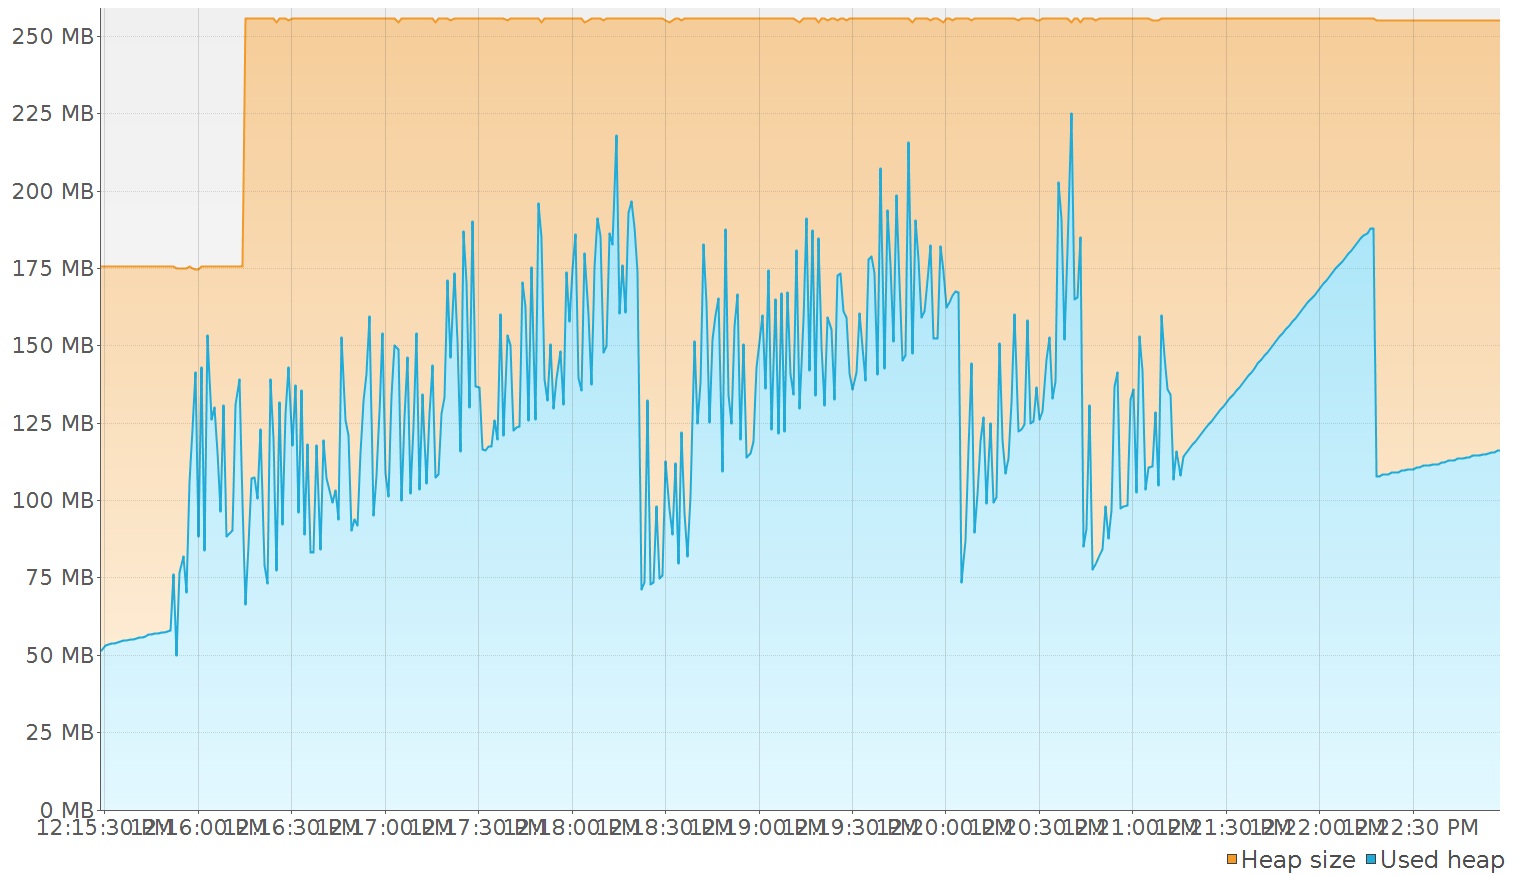
Stopping JMeter and then calling the DELETE method again will stabilize the consumed memory to around 125Mb. So we have around 75Mb of leaked memory. Results can be seen in the fallowing image:
In jvisualvm we can force a GC to run by clicking the Perform GC. We can see the allocated memory decreasing. Now let’s do the Heap Dump, a new tab will open and in the Classes window we can see all the classes with number of instances and allocated memory that are used in the app. Result can be seen in the fallowing image:
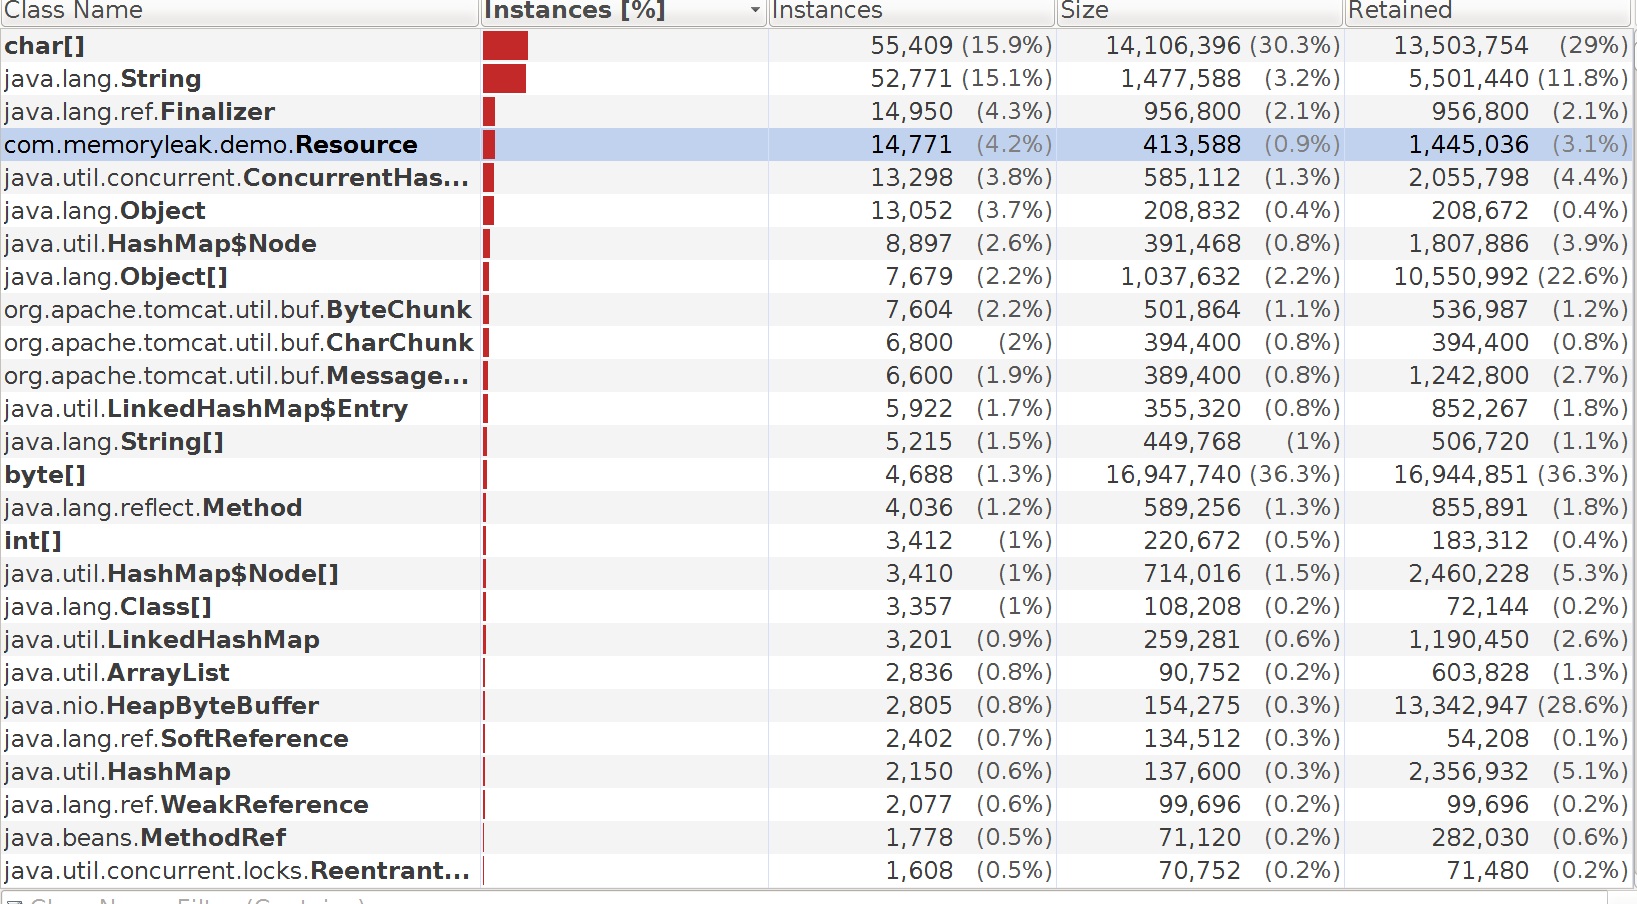
We notice our com.memoryleak.demo.Resource class holding 14771 instances. This does not look right because by calling the GET /resources request we receive an empty array. So it is a clear result that we have a leak of 14771 Resource instances.
Tip
The Resource class can overwrite this finalize method from Object class that will be called every time the object is garbage collected.
public class Resource {

    private int id;
    private String data;

    // constructors, getters, setters, equals, hashCode and toString here

    @Override
    protected void finalize() {
        System.out.println("GC on resource: " + this.toString());
    }
}
Having this method in place when calling the DELETE /resources we can notice that even if we destroy the references to our Resource objects, the GC is not invoked immediately. We have to wait a few seconds or even minutes until we notice the objects were cleared from memory and finalize is called:
...
GC on resource: Resource{id=2953, data='data_6094'}
GC on resource: Resource{id=5108, data='data_5925'}
GC on resource: Resource{id=2295, data='data_659'}
...
Investigating memory leaks is a tedious job on big applications because we need to dig through a lot more instances. Using tools la JMeter we can simulate heavy load so our memory leak is a log bigger, being easier to spot in a pool of millions of objects. There are other tools that help with investigating the heap dump better but I will leave this for another article.
I hope this was educational.
Happy coding!